After performing the data exploration, selection and, of course, implementation of a model and obtaining the results in the form of probability or class, the next step is to determine the effectiveness of the model. based on metrics for classification.

Contents
ToggleWhat metrics for classification?
We can use classification performance metrics such as Log-Loss, Accuracy, AUC (Area under Curve), etc. Another example of a metric for evaluating machine learning algorithms is precision, recall, which can be used to sort algorithms primarily used by search engines.
The metrics you choose to evaluate your machine learning model are very important. The choice of metrics influences how the performance of machine learning algorithms is measured and compared. Before wasting any more time, let's jump right in and see what those metrics are.
Confusion matrix
The confusion matrix is one of the most intuitive and simple measures (unless of course you are not confused) used to determine model accuracy and precision. It is used for classification problems where the output can be of two or more class types.
Before we dive into what the confusion matrix is and what it conveys, let's say we are solving a classification problem where we are predicting whether a person has cancer or not.
Let's give a label to our target variable:
1: When a person has cancer 0: When a person does NOT have cancer.
Now that we have identified the problem, the confusion matrix is a two-dimensional array (“Actual” and “Predicted”), and sets of “classes” in both dimensions. Our actual classifications are columns and the intended ones are rows.
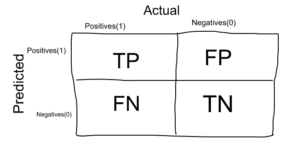
The confusion matrix itself is not a performance metric as such, but almost all performance metrics are based on the confusion matrix and the numbers it contains.
True positives (TP): true positives are cases where the actual class of the data point was 1 (true) and the predicted value is also 1.
Ex: The case where a person actually has cancer (1) and the model classifying his case as cancer (1) falls within the True positive.
True negatives (TN): true negatives are cases where the actual class of the data point was 0 (false) and the predicted value is also 0.
Ex: The case where a person DOES NOT have cancer and the model classifying his case as No cancer falls under True Negatives.
False positives (FP): false positives are cases where the actual class of the data point was 0 (false) and the predicted value is 1 (true). False because the model predicted incorrectly and positive because the predicted class was positive.
Ex: A person NOT suffering from cancer and the model classifying his case as a cancer reports false positives.
False negatives (FN): false negatives are cases where the actual class of the data point was 1 (true) and the predicted value is 0 (false). False because the model predicted incorrectly and negative because the predicted class was negative.
Ex: A person with cancer and the model classifying his case as cancer-free reports false negatives.
The ideal scenario that we all want is for the model to yield 0 false positives and 0 false negatives. But this is not the case in real life because no model will NOT be accurate to 100% most of the time.
We know there will be an error associated with every model we use to predict the true class of the target variable. This will result in false positives and false negatives (i.e. the model classifies things incorrectly relative to the actual class).
There is no hard and fast rule that says what should be minimized in all situations. It just depends on the needs of the business and the context of the problem you are trying to solve. Based on this, we might want to minimize false positives or false negatives.
Minimize false negatives
Let's say that in our cancer detection problem example, out of 100 people, only 5 people have cancer. In this case, we want to correctly classify all cancer patients because even a very BAD model (Predict everyone as NON Cancerous) will give us an accuracy of 95 % (will get to how accurate).
But, in order to capture all cases of cancer, we might end up doing a classification where the person who does NOT have cancer is classified as cancerous. This might be acceptable as it is less dangerous than NOT identifying/capturing a cancer patient since we will send cancer cases for further review and reporting anyway. But missing a cancer patient will be a huge mistake because no further examinations will be performed on them.
Minimize false positives
For a better understanding of false positives, let's use a different example where the model classifies whether an email is spam or not.
Let's say you're expecting an important email, like a response from a recruiter or an admission letter from a university. Let's label the target variable and say 1: “The email is spam” and 0: “The email is not spam”.
Suppose the model classifies that important email you are desperately waiting for as spam (false positive case). Now, in this situation, it is rather bad to classify a spam as important or not spam because in this case, we can always go ahead and delete it manually and it is not painful if it happens once in a while. Thus, when classifying spam, it is more important to minimize false positives than false negatives.
Accuracy
Accuracy in classification problems is the number of correct predictions made by the model over all kinds of predictions made.
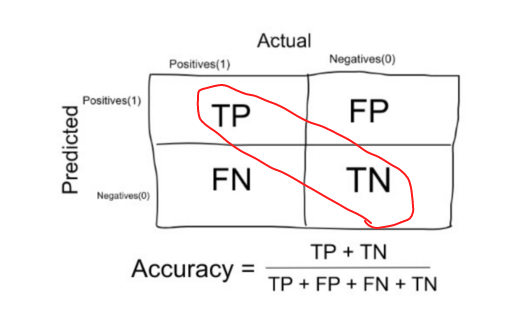
In the numerator are our correct predictions (true positives and true negatives) (marked in red in the figure above) and in the denominator are the type of all the predictions made by the algorithm (both good and bad ).
Accuracy is a good measure when the classes of target variables in the data are nearly balanced.
Ex: 60 % of the classes in our fruit image data are apples and 40 % are oranges.
A model that predicts whether a new image is Apple or Orange, 97 % times correctly is a very good measure in this example.
Accuracy should NEVER be used as a measure when the classes of target variables in the data constitute the majority of a class.
Ex: In our cancer detection example with 100 people, only 5 people have cancer. Let's say our model is very bad and predicts that not every case is cancer. In doing so, he correctly classified these 95 non-cancer patients and 5 cancer patients as non-cancerous. Now, even though the model is terrible at predicting cancer, the accuracy of such a bad model is also 95 %.
Accuracy (accuracy)
Let's use the same confusion matrix that we used earlier for our cancer detection example.
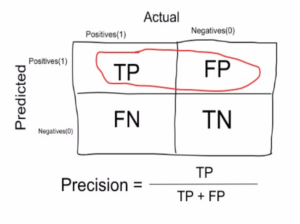
Precision is a measure that tells us what proportion of patients we have diagnosed with cancer actually had cancer. Predicted positives (people predicted as cancerous are TP and FP) and people who actually have cancer are TP.
Ex: In our cancer example with 100 people, only 5 people have cancer. Let's say our model is very bad and predicts every case like cancer. Since we predict that everyone has cancer, our denominator (true positives and false positives) is 100 and the numerator the person with cancer and the model predicting their case as cancer is 5. So in this example, we can say that the accuracy of such a model is 5 %.
Recall or sensitivity (Recall / Sensitivity)
Recall is a measure that tells us what proportion of patients who actually had cancer were diagnosed by the algorithm as having cancer. True positives (people with cancer are TP and FN) and people diagnosed by the model with cancer are TP. (Note: FN is included because the person actually had cancer even though the model predicted otherwise).

Ex: In our cancer example with 100 people, 5 people actually have cancer. Let's say the model predicts each case as cancer.
So our denominator (true positives and false negatives) is 5 and the numerator, the person with cancer and the model predicting their case as cancer is also 5 (since we correctly predicted 5 cases of cancer). So in this example we can say that the recall of such a pattern is 100 %. And the accuracy of such a model (as we saw above) is 5 %
Clearly, recall gives us information about a classifier's performance with respect to false negatives (how many did we miss), while precision gives us information about its performance with respect to false positives (how many did we catch).
Accuracy is about being precise. So even if we managed to capture a single case of cancer, and we captured it correctly, we are 100 % accurate.
The recall is not so much about correctly capturing cases, but rather capturing all cases that have "cancer" with the response "cancer". So if we still label each case as “cancer,” we have 100 recall %s.
So basically if we want to focus more on the minimization false negatives, we would like our recall to be as close to 100 % as possible without the accuracy being too bad and if we want to focus on minimizing false positives, then our goal should be to make Accuracy as close as possible to 100 %.
Specificity
Specificity is a measure that tells us what proportion of patients who did NOT have cancer were predicted by the model to be cancer free. True negatives (people who do NOT have cancer are FP and TN) and people we have diagnosed as having no cancer are TN. (Note: FP is included because the person did NOT actually have cancer, even though the model predicted otherwise). Specificity is the exact opposite of recall.
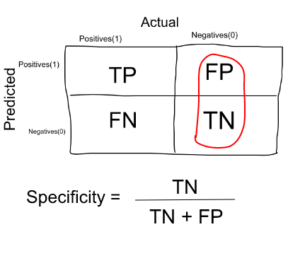
Ex: In our cancer example with 100 people, 5 people actually have cancer. Let's say the model predicts each case as cancer.
So our denominator (false positives and true negatives) is 95 and the numerator, person with no cancer and the model predicting their case as no cancer is 0 (since we predicted each case as cancer). So in this example we can say that the specificity of such a pattern is 0 %.
F1 score (F1 score)
We don't really want to carry both Precision and Recall in our pockets every time we build a model to solve a classification problem. It is therefore preferable to obtain a single score that represents both precision (P) and recall (R).
One way to do this is to simply take their arithmetic mean. i.e. (P+R)/2 where P is Precision and R is Recall. But it's pretty bad in some situations.
Suppose we have 100 credit card transactions, of which 97 are legitimate and 3 are fraud and say we have found a model that predicts everything as fraud.
The precision and recall of the example is shown in the figure below.
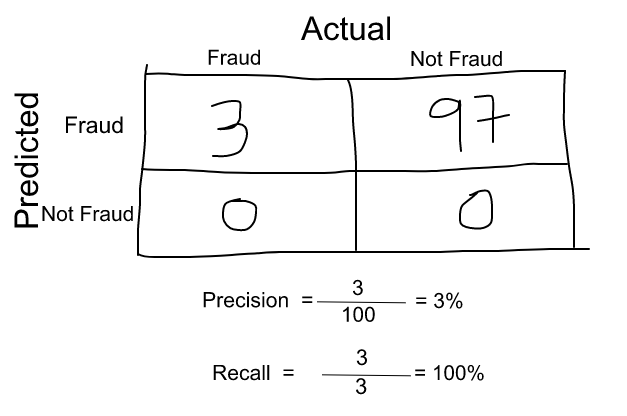
Now, if we just take the arithmetic mean of the two, it comes out to almost 51 %. We shouldn't give such a moderate rating to a terrible model because it just predicts every transaction as a fraud.
So we need something more balanced than the arithmetic mean and that is the harmonic mean.

The harmonic mean is given by the formula shown in the figure on the left.
The harmonic mean is a kind of mean when x and y are equal. But when x and y are different, then it is closer to the smaller number than the larger number.
For our previous example, F1 Score = Harmonic Mean (Precision, Recall)
F1 score = 2 * Precision * Recall / (Precision + Recall) = 2*3*100/103 = 5%
So if a number is really small between precision and recall, the F1 score raises a flag and is closer to the smaller number than the larger, giving the model an appropriate score rather than just an arithmetic mean.
See you next lesson!
So far we have seen as metrics for classification what is confusion matrix, what is accuracy, precision, recall (or sensitivity), specificity and F1 score for a problem classification. In the next article, other measures that can be used as metrics for classification like AUC-ROC curve, log loss, F-Beta score, etc.
