Contents
ToggleGraph Theory Project: Sim City 2030
This project on the graph theory, the linear programming, branch & bound and flow problems is an introduction to smart grid problems.

Hello dear NE engineers,
Your team has successfully won the Sim City 2030 project. Our mayor, the venerable Frédéric Fauberteau (you can call him god) and his four advisers Guillaume Guérard (the one, the only), Pascal Clain (what else?), Samir Yahiaoui (you will be knocked down) and Marie-Noémie Thai (our goddess) have chosen you to build the largest solar panel plant in the region:
Die Sonne!
Your work, which you will submit in the form of Deliverables, will focus on the following subjects:
- Define where to build the plant (Session 1)
- Define energy needs (Session 2)
- Set up the integration plan for the power plant and a new power line(Session 3)
Deliverable 1: where to build the plant?
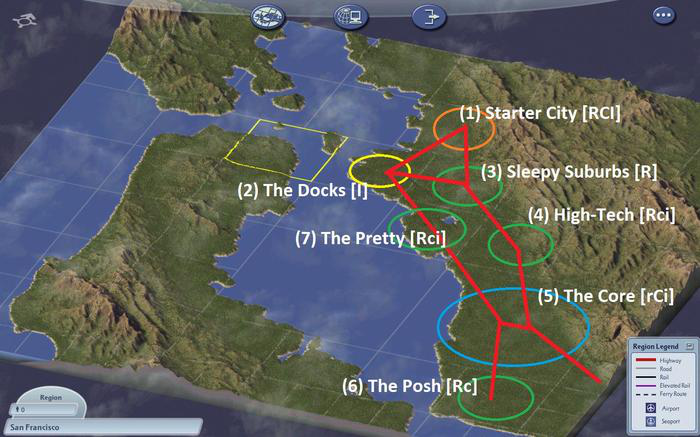
Starter City is located in an agglomeration of three cities (with The Docks and The Core), served by three nearby power plants (Sleepy Suburbs, The Pretty and The Posh).
Before integrating the Die Sonne project plant into the local network, you need to know its location. For this, the meteorologists placed sensors in order to know the active power of various sites in the High-Tech site of Simicon Valley and deduced various favorable locations from it.
Building the power plant comes at a cost and putting in power lines to the nearest transformer also comes at a cost.
Before starting this first deliverable, I invite you to learn about the basics of graph theory.
Now that you have familiarized yourself with the notion of graph, we are going to try a first method to know where to build the plant.
The graph is as follows with A, B, C the three construction possibilities, the cost of the power stations is the same, we will neglect it later. Nodes D and E are transmission stations and node F is the station already existing in the network. The objective is therefore to find where to place the plant (A, B or C) in such a way as to minimize the cost of the lines from this vertex to F.
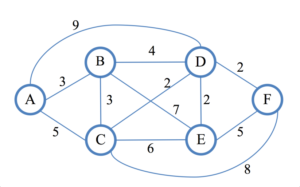
In order to know the shortest way from A to F, you will build a tree of decision. At depth 0 is your powerhouse: node A.
At each depth, for each node of the previous depth, you will find all the paths to the adjacent vertices that are not part of its parents. If a branch ending with the vertex X has a shorter path than another branch ending with X, then it is not necessary to do the calculation for the branch with a larger path, the vertex is closed.
Let's start building the decision tree of A. The vertex A can go to B in 3, C in 5 and D in 9. This gives the following tree.
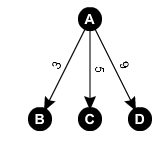
Then we take the depth 1 and we start the process again with B then C then D.
Here B can go to D in 4, in E in 7, in C in 3 and in A in 3. A is one of the parents of B (follow the arcs going up against the direction). In this example we will only do the calculations for branch A to B.
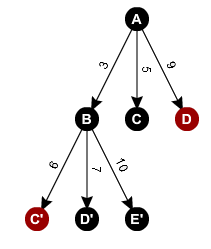
For each path, we add the arc of the parent with the arc of the child. Here for B to D we will have 3 + 4, to E we will have 3 + 7 and to C we will have 3 + 3.
We notice that branch A to B to D has a cost of 3 + 4 = 7, so we can close branch A to D. Branch A to B to C has a cost of 3 + 7 = 10 which is greater than branch A to C which has a cost of 5. We can therefore close branch A to B to C. At this stage, we have already closed two branches of our decision tree (in red in the tree).
Attention, if you continue on branch A to B to D you will then have A and B as parents.
Complete the branch & bound decision tree. The shortest path from A to F will be the branch going to F such that F is not closed.
Congratulations ! You have just made your first algorithm optimization: Branch & Bound! All that remains is to code.
Computers are always faster than humans, which is why you need to code a decision tree algorithm. Adding branch & bound (closing unnecessary nodes) will provide bonus points. In your program, each node will have for information:
- The weight of his path
- The node visited in progress
- The nodes to visit (which will therefore be direct children)
- Belonging to the shortest path from B (then C) to F that you will calculate after creating the tree?
Which location will have the lowest cost of building the lines? Show proof by displaying the decision trees that your program displays?
Scale
- Branch & bound (10 points)
- Tree writing (2 points)
- Mark the closed nodes (3 points)
- Mark the shortest path (3 points)
- Conclusion (2 points)
- Decision tree code (10 points)
- Flowchart of the algorithm (3 points)
- Explanation of the process (3 points)
- Screen print of the decision tree display (2 points)
- Mark the shortest path (2 points)
- BONUS close unnecessary nodes (2 points)
Deliverable 2: What are the energy needs?
In order to know the energy needs, we must establish the routing of the energy of the existing plants towards the cities of the agglomeration. This routing will determine that it is indeed a problem of energy production and not a problem at the level of the distribution.
We know that plant 1 produces a maximum of 6 MWh, plant 2 produces a maximum of 10 MWh and plant 3 produces a maximum of 6 MWh. City 1 (Starter City) consumes 12MWh, city 2 (The Core) consumes 10 MWh, city 3 (The Docks) consumes 3MWh.
The energy is conducted from the power stations to the cities by medium voltage lines according to the following diagram (Ci for the power stations and Vi for the cities).
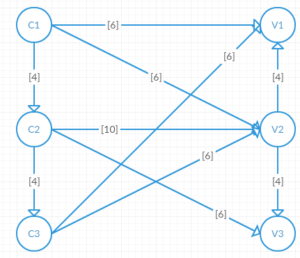
In square brackets you have the capacity of the line in MWh.
In order to know the energy needs, you need to solve a flow problem.
You must therefore first transform the above graph into a flow, that is to say with a single source and a single well. Create a mother source which will be connected to each plant and having a capacity equal to the production of the plants (for example Source To C1 will have a capacity of 6). Likewise, you will connect each city to the father well, the capacity of each arc will be equal to the consumption of the city in question.
Construct the associated graph and solve the flow problem with the help of the algorithm of Ford-Fulkerson.
What is the maximum flow ? How much do cities need? How many MWh should the solar power plant produce?
You have become pros in optimization ! Now we are going to see a little automation.
The solar power station is attached to batteries. When the energy produced by the plant is not useful to meet consumption, the energy is then stored. In order to automate the process, the storage and retrieval of the battery will be done only via an electronic circuit.
You need to model this process using a circuit and an arduino. A servomotor will represent the consumers, and LEDs will have to light up according to the flow passing through the line. The energy produced by the power plant in the circuit will depend on a photoresistor.
Using a servo motor, a photoresistor, LEDs and the arduino, come up with a diagram to model the system. The diagram should be done with http://fritzing.org/
Scale
- Flow problem (10 points)
- Construction of the graph (3 points)
- Execution of the algorithm -at least two iterations- (5 points)
- Conclusion (2 points)
- Electronic diagram (10 points)
- Explanation of the diagram (5 points)
- Fritzing diagram (4 points)
- Relevance and simplicity of the model (1 points)
Deliverable 3: artificial intelligence versus human deduction
You have determined in deliverable 1 the cost of the line for the new control unit. This line will go from the new plant to the C1 plant. And you determined in deliverable 2 that this solar power plant will have to produce 3 MWh. You will now see if the integration of this plant will solve our problem of overconsumption, and determine the capacity of the new line.
It is trivial that the new line will have a capacity of 3MWh since it is the only arc coming out of the new plant. Let’s overlook this fact, the idea is to prove things, not deduce them.
In order to validate your dimensioning, you will add a vertex C4 and an arc from C4 to C1 of infinite capacity. Once you have determined the graph, perform the Ford-Fulkerson algorithm. You will have two possibilities:
- If the demand is satisfied, then the flow passing through the arc (C4, C3) determines the necessary capacity of the line
- If the demand is not met, then it must be determined which lines are preventing more energy from being delivered.
When do you deduct for the new line?
Now let's get down to business!
One last task awaits you. You need to determine the impact that a Bowser's attack can have on the New Energy Grid.
Carry out the routing considering that the arc (C2, V2) is cut. In order to understand the consequences of this break in the network, you must perform the min cut.
The min cut is done after finding a maximum flow with Ford-Fulkerson.
This cut will make it possible to understand that they will be the next lines which will be in congestion.
What do you deduce from this?
Nothing beats an example by an electronic assembly representing the network with the help of LEDs to show the flow and resistances so that the flow is identical to your calculations. Be careful, you have many calculations to do, including voltage divider bridges!
Removing a wire will show the impact on the network (this is true at the time of the cut, subsequently the network readjusts itself).
What do you notice ?
Scale
- Line sizing (7 points)
- Writing the graph (3 points)
- Calculation of the maximum flow (3 points)
- Conclusion (1 points)
- Line break (7 points)
- Calculation of the maximum flow (3 points)
- Find the min-cut (3 points)
- Conclusion (1 points)
- Arduino mount (7 points)
- Calculation of resistances (5 points)
- Fritzing diagram (1 points)
- Conclusion (1 points)
